
Our Transparency Dashboard™ is the keystone of SLF’s vision and is the only one of it’s kind in the leather industry. The Dashboard is what enables us to realise our “A.I.M. Approach” – Accessible, Inclusive and Modular for the benefit of all stakeholders.
The Transparency Dashboard™ demonstrates the ESG responsibility of the leather value chain to customers and consumer through:
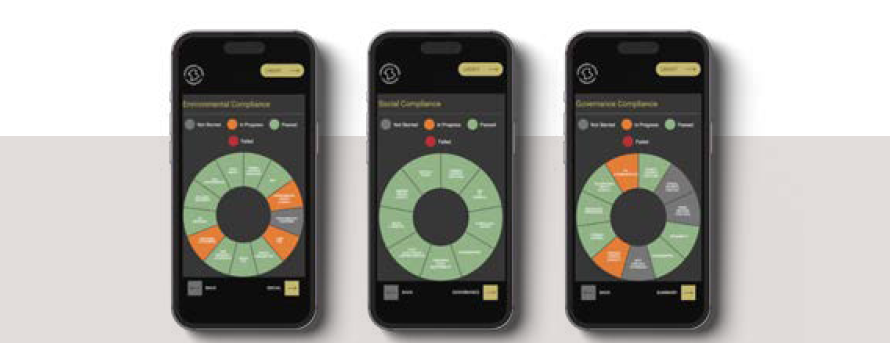
Our Transparency Dashboard™ works on a simple traffic light system for ease of understanding. The sections are colour coded as follows:
NOT STARTED
IN PROGRESS
PASSED
FAILED
The basic view of the Transparency Dashboard™ is open source, however Partners of SLF can click on each section to see the basis of assessment and the metrics related to the result.
Other interested parties may request access to the full Transparency Dashboard™ with the permission of the Partner company.
“The framework developed by the Sustainable Leather Foundation is a significant step forward in providing transparency and integration throughout the leather value chain. The Transparency Dashboard™ coupled with the web platform provide examples of simple yet effective tools to put a sustainability lens on the performance of leather stakeholders.…”
Mauricio S. Bauer, WWF Senior Director, Beef & Leather Supply Chains (Former)
To find out more get in touch and a member of the team will get back to you as soon as possible.
| Cookie | Duration | Description |
|---|---|---|
| cookielawinfo-checkbox-analytics | 11 months | This cookie is set by GDPR Cookie Consent plugin. The cookie is used to store the user consent for the cookies in the category "Analytics". |
| cookielawinfo-checkbox-functional | 11 months | The cookie is set by GDPR cookie consent to record the user consent for the cookies in the category "Functional". |
| cookielawinfo-checkbox-necessary | 11 months | This cookie is set by GDPR Cookie Consent plugin. The cookies is used to store the user consent for the cookies in the category "Necessary". |
| cookielawinfo-checkbox-others | 11 months | This cookie is set by GDPR Cookie Consent plugin. The cookie is used to store the user consent for the cookies in the category "Other. |
| cookielawinfo-checkbox-performance | 11 months | This cookie is set by GDPR Cookie Consent plugin. The cookie is used to store the user consent for the cookies in the category "Performance". |
| viewed_cookie_policy | 11 months | The cookie is set by the GDPR Cookie Consent plugin and is used to store whether or not user has consented to the use of cookies. It does not store any personal data. |